Tuesday, October 13, 2020


When we look at the 5 min chart, and compared with the 15 min chart, we can see the move crude has just done in the past few minutes to the downside.

Again, as in the 15 min chart, the moves can easily be tracked with the correct set of technical indicators, fundamentals, and time frames.

For educational purposes only and not intended as a financial advice of any kind.


Crude Oil futures 15 min chart. We can notice from prior days the lower price at this time. Looking back in history to trade if up or decide levels when down if the move goes that way. A volume watch is needed to get into a good move.

With political news as fundamentals, price may move accordingly. An easy to trade future. Also watch airlines news to go along with crude oil moves as this will impact the price of crude oil and the market moves.

For educational purposes only and not intended as a financial advice of any kind.

Friday, October 9, 2020


Russell 2000 E-Mini Index Futures, December 2020 Contract. Analysis on a major support and resistance levels to watch for. Above a weekly chart showing such of a trading range. We look for opportunities within, post and prior to that range.

For educational purposes only and not intended as a financial advice of any kind.


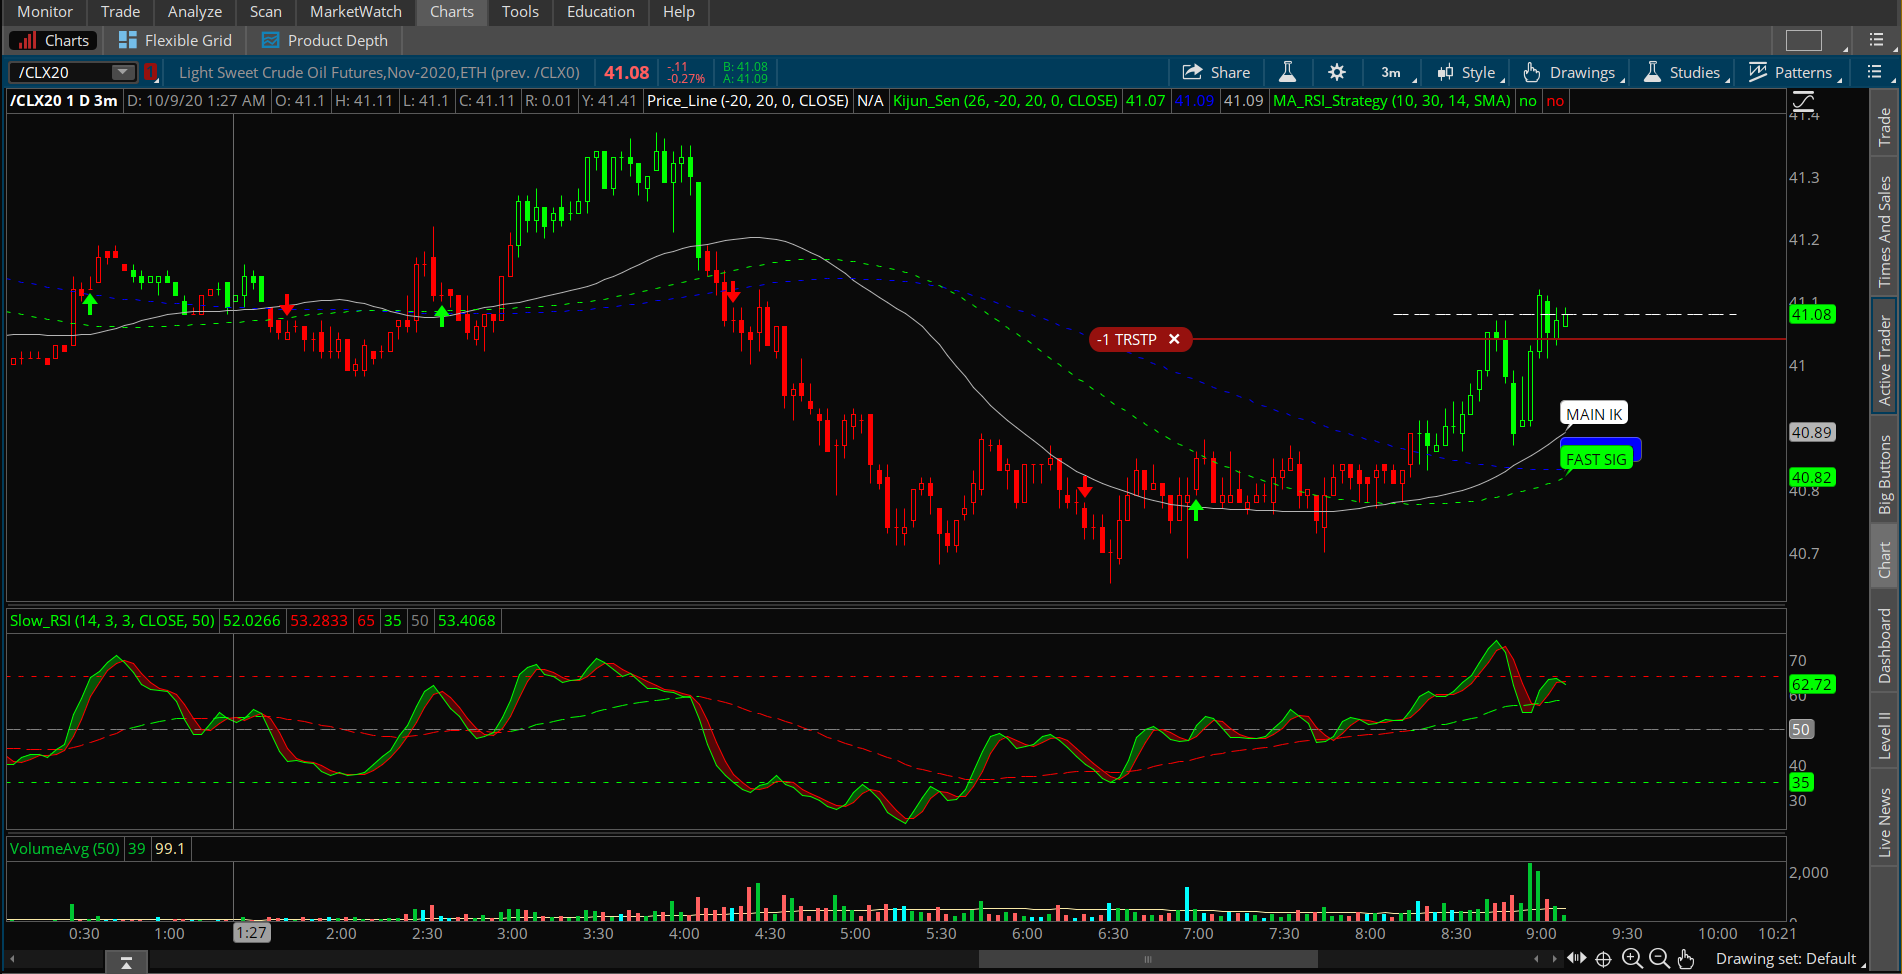
Light Sweet Crude Oil Futures, November 2020 contract. A move this morning that provides some profits when traded this early. An example in a 3 min chart of the trade. Small moves or within range, provide nice opportunities.

For educational purposes only and not intended as a financial advice of any kind.
Thursday, October 8, 2020


E-Mini Russell 2000 Index Futures on a weekly chart. It is easy to notice we are on a bullish pattern. For trading purposes and to watch for a new high if it will happen, the weekly chart has a clear plot of what is going on.

As far as the direction of the market, for profitability and any good move to any side, we can then take advantage of such moves when trading and looking for such kind of opportunities.


For educational purposes only and not intended as a financial advice of any kind.

Tuesday, October 6, 2020


Russell 2000 timing the market and move. We can see how every day and time when the volume bars are above its daily average, on a 4 hr chart. For trading opportunities when the price is trending up or when to short, both opportunities are very clearly defined.

We have been trading its price overnight, and at market opening on the historical volume patterns. Notice the volume bars when above the average as per timeframe on the chart.

Again, for informational purposes only and not intended as a financial advice of any kind. 

Monday, October 5, 2020


Natural Gas behavior has been great this morning. Then in the afternoon a correction to the upside in a non so sharp of a way. This means it trends was favorable for long positions during the morning, then it became a sellers choice in the afternoon.

Trading such of a future is easy and very profitable when done with the right tools as shown in the chart. Also, the entry and exit strategy, the marked moves and news, all come up as part of the study or homework an investor should do.

Preventing losses is the key and keeping the profits makes someone one a winner.

For educational purposes only and not intended as a financial advice of any kind.